Logging and Monitoring
Page Contents
Operational Monitoring and Logging
Standard Tooling in LZiaB
Within LZiaB, our default approach to logging, monitoring and alerting is to use Google’s Cloud Operations. Cloud Operations (previously known as Stack Driver) is a cloud-native integrated platform that provides many capabilities. Here are just some of these capabilities:
| Capability | Overview |
|---|---|
| Cloud Monitoring | Monitoring, utilisation, visualisation, dashboards, health and uptime checks, SLIs, and alerting. Within LZiaB, ops agents are automatically deployed to instances by default, in order to enrich VM metrics that are sent to Cloud Monitoring. |
| Cloud Logging | Ingests logs from various sources, including audit logs, network (VPC flow) logs, firewall logs, and other sources. Many GCP services have logging built-in, e.g. App Engine, GKE, Cloud Functions. For those that don’t, an agent is typically installed, e.g. GCE instances. Within LZiaB, ops agents are automatically deployed to instances by default, ensuring that standard OS system logs, and logs from commonly used third party applications (like Apache, Nginx, Tomcat) are automatically captured and sent to Cloud Logging. Logs can be filtered and exported, if required. Cloud Logging then provides viewing, aggregation, searching, filtering, and the ability to export and integrate. |
| Trace | Distributed tracing system that collects latency data and displays data relating to latency and propagation of requests through an application, giving near real time performance insights and per-URL statistics. |
| Profiler | Visualise and continuously analyse the continuous resource usage (e.g. CPU and memory), to identify bottlenecks and determine if any resources are using excessive resources. Uses statistical sampling, so very little overhead. |
Cloud Platform Team Responsibilities
The Cloud Platform Team will monitor all LZiaB resources that are shared, including all resources deployed to the Hub VPC.
Tenant Responsibilities
- Tenants are expected to set up their own logging, monitoring, alerting, and dashboards. This should be apparent, since tenants will each have unique combinations of resources and applications.
- Tenants will set up nofications, e.g. for the generation of email alerts to the operational team responsible for the application.
Tenant Dashboards
A Cloud Operations dashboard allows you to aggregate various metrics into a single canvas, and display them in the form of panels, tables, charts and graphs. Your dashboards can include metrics such as:
- Uptime checks
- Alerting policies
- Quota utilisation
- Filtered logs
- VM instance CPU utilisation
- Instance group size
- GKE cluster metrics
- Cloud SQL CPU utilisation
- Cloud SQL disk utilisation
- Bucket storage utilisation
- Cloud CDN utilisation
- Firewall Insights
- Load balancer round trip time
- Service latency
- VPC network flow logs
- Service Level Objectives (SLOs)
You will have the ability to deploy from a library of predefined dashboards.
Alternatively (and probably more usefully), you can create your own customer dashboards. Your dashboards should be defined in JSON and provisioned using Terraform. Outside of your sandbox environment, you should not be created dashboards in the Google Console by hand.
Each tenant will be provided with an initial basic dashboard, accessible from Monitoring -> Dashboards. This is deployed from a dashboard stored in data\dashboards in the tenant GitLab repo.
It may be useful to look at other sample dashboards. See here for guidance on how to leverage sample dashboards.
Security Information and Event Management
Standard Tooling in LZiaB
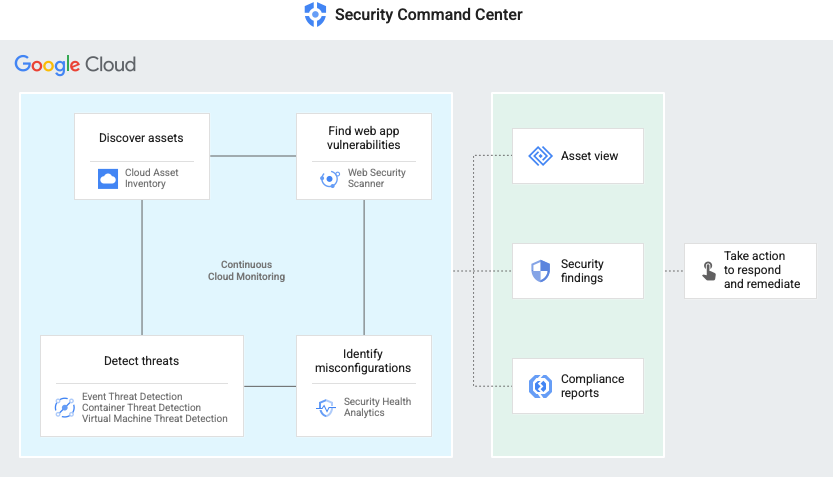
LZiaB will leverage the Google Security Command Centre (SCC) Premium.

SCC aggregates and correlates findings from multiple sources, including:
- Security health analytics - Automatic detection of common vulnerabilities, misconfigurations, drift from secure configurations, and any breach of policies.
- Anomaly detection - Uses behaviour signals from outside your system to display granular information that helps you detect cloud abuse behaviour for your projects and VM instances.
- Active event threat detection - Uses threat intelligence and detection algorithms to notify the SCC of any threats. Automatically detects malware and data exfiltration, and events such as brute force attacks, spurious access management, breach attempts, sensitive data transmission, modification of 2-step verification settings. Monitors logs from various sources, including platform, network, system, and audit logs.
- Container threat detection - Provides runtime security for GKE containers to help detect reverse shells, suspicious binaries, and libraries.
- Web security scanner - Scans public web applications for common application vulnerabilities.
SCC then provides actional insights and analytics of these findings, through:
- Dashboards
- Alerting
- Integration with Google’s automatic Data Loss Prevention (DLP) capabilities
- Integratoion with Google Cloud Armor, which provides DDoS and application firewalling
- Integration with anomaly detection
Security Response
The SCC is actively monitored by our Security Operations Centre.